


Testing Innovations in SCC
advanced topics | formwork pressure | robustness | testing innovations
falling ball viscometer | system configuration & calibrations | experimental results & potential for field testing
measuring the segregation resistance | segregation probe test | other methods in segregation measurement
summary | references
The use of self-consolidating concrete (SCC) has grown tremendously since its inception in the 1980s. Different from a conventional concrete, SCC is characterized by its high flowability at the fresh state. This helps the SCC to satisfy the performance requirement in the field, such as giving a smooth surface finish, encapsulate the reinforcement without blocking of aggregates, etc. Because of the material performance in its fresh state, the existing testing methods for conventional concrete are no longer suitable for SCC.
Numerous efforts have been explored for new testing methods on SCC in the past decade. There are several organizations that collect the work in this area. The RILEM technical committee, TC 174-SCC (Self-Compacting Concrete), ASTM Subcommittee C09.47 (Self-Consolidating Concrete), ACI Committee 237 (Self-Consolidating Concrete), and TRB Committee AFN10 (Basic Research and Emerging Technologies Related to Concrete) are good examples. Symposiums and workshops on this topic were given by these organizations and several test methods on the flowability of SCC have been popularized since then.
Among the existing test methods, slump flow test, using the traditional slump cone, is the most common testing method for flowability (or filling ability) and was standardized in September 2005 as ASTM C 1611. During the test, the final slump flow diameter and T50 (time needed for concrete to reach a spread diameter of 20 in. (50 cm)) are recorded. The U-Box, L-Box, and especially J-ring (ASTM C 1621) tests are used for the evaluation of passing ability. These fresh properties are governed by the rheological properties of the material and some studied have been conducted in the lab to investigate the correlation among the measured parameters from above-mentioned methods (e.g. correlating T50 and the flow velocity at L-box test to the plastic viscosity). A good test method that can help to quantitatively determine the viscosity and the yield stress of SCC in the field is urgently needed. Segregation resistance is another important issue for SCC. Surface settlement test and the penetration test are two methods to evaluate the resistance to segregation of SCC in the field. However, these methods focus on the static segregation of SCC and the theoretical background for these methods is still unclear. There are no proper test methods for evaluating the dynamic segregation of SCC.
Researchers at the Center for Advanced Cement-Based Materials (ACBM) are targeting development of new test equipment and methods for in-situ evaluation of SCC with an emphasis on viscosity, yield stress, and segregation resistance. The research strategies are: (1) to better understand the fundamental aspect of rheology; (2) to develop new techniques based on simple concepts; and (3) to develop the corresponding equipment that is both lab- and field-friendly. To be different from the existing methods for testing SCC, it is required that these new methods can help to evaluate the properties of SCC not only qualitatively but quantitatively. The research tracks are subdivided into two parts: rheological properties and segregation resistance, which will be described in the following sections of this paper.
Lead Author:
Zhihui Sun, University of Louisville
Contributing Authors:
Lin Shen, University of Illinois at Urbana-Champaign; Amedeo Gregori, University of L’Aquila, Italy; Raissa Ferron, Northwestern University; Leslie Struble, University of Illinois at Urbana-Champaign; David Lange, University of Illinois at Urbana-Champaign; Kamal H. Khayat, University of Sherbrooke; Surendra P. Shah, Northwestern University
Falling Ball Viscometer
The basic parameter influencing the performance of the fresh SCC in casting is its rheological properties. Thus, studying the rheology of SCC has become one of the central issues at ACBM. Concrete rheometers with various sensor geometries were designed and used in the past ten years. A comparison of different rheometers was conducted at the National Institute of Standards and Technology (NIST). The study showed that for the same concrete mixtures, different rheometers yielded different results. The reasons could be attributed to various geometries of the sensors and rheometers, testing procedure and the inhomogeneity of the material itself. Another way to investigate the rheological behavior of materials can be made with the application of a falling/pulling ball viscometer. The viscosity calculation is based on the velocity of the moving ball and the equilibrium of forces. The external forces are normally traced with a pulley system or the intensity of a magnetic field, neither of which is suitable for field measurement. The objective of this research is to design a falling ball viscometer, which can be used under both the lab and field conditions.
System Configuration and Calibrations
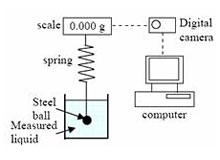
Fig. 1 Configuration of the falling ball viscometer
A falling ball viscometer was designed at ACBM at Northwestern University using a scale with accuracy of 0.001g, an elastic tensile spring, and steel balls of various diameters (Fig. 1).
When a steel ball is suspended by the spring and is allowed to move in the fluid, then the forces acting on the ball can be resolved into four components. As shown in Fig. 2, these components are gravity (W), tensile force (T), buoyancy (B), and drag force (D). During the measurement, the spring is hooked to a sensor that is located at the bottom of the scale. By suspending the steel ball with the spring, the tensile force in the spring during the downwards movement of the ball can be continuously recorded by reading the numbers shown on the scale.
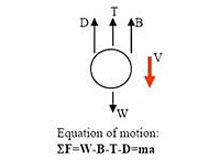
Fig. 2 Free body diagram of the ball
Once the tensile force is known, the displacement of the ball can be computed and this allows for the calculation of the velocity and acceleration of the ball. Hence, the only force left to be determined is the drag force, and it can be solved using the equation of motion shown in Fig. 2. In steady state condition and when Reynolds number (Rn) is less than 0.5, the drag force can be linearly related to the velocity by applying Stoke’s Law for a spherical particle as shown in equation 1:
![]() (2.1)
(2.1)
where, η is the viscosity of the measured liquid; r is the radius of the ball; v is the velocity of the ball; and ρ is the density of the measured liquid. From the equation, it can be noted that the drag force is linearly related to the velocity of the ball and the size of the moving ball.
Equation 1 is valid for a spherical particle moving with a constant velocity in a Newtonian fluid. However, with the configuration that introduced, the velocity of a moving ball changes with time. This is attributed to the changing of the tensile force as the spring elongates according to the ball movement. Thus, to make sure the used theory is still valid for the used configuration, a calibration for the designed viscometer is necessary.
Various Newtonian fluids with known viscosities were used for the system calibration. It was found that the viscosity of the measured liquid can be determined through equation 2, where Ke is the slope of the drag force-ball velocity curve that determined experimentally:
![]() (2.2)
(2.2)
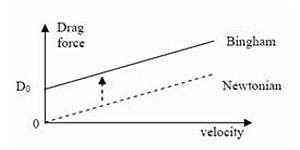
Fig. 3 Validity for Bingham materials
This calibration is proved to be efficient for Newtonian fluids. It is suggested that the calibration should also be valid for non-Newtonian fluids, if the material behaves according to Bingham model. For a Bingham material, drag force D is linearly related to the velocity of the moving ball, however, the linear line has an intersection with the y axis as shown in Fig. 3, where D0 can be correlated to the yield stress of the material. The solid line in the figure can be shifted down until it intersects with the origin. This implies that the calibration of the system should also be valid for Bingham fluids. Fresh concrete is normally regarded as a Bingham fluid, thus, the viscometer has a high potential to be applied to concrete. The yield stress acts tangentially to the surface of the steel ball. Thus, the relationship between the initial resistance to motion(subsequently called initial drag force (D0)) and the yield stress (Ty) of the measured liquid can be expressed as follows:
![]() (2.3)
(2.3)
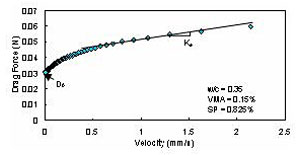
Fig. 4 Falling ball measurement for cement paste with VMA
Experimental Results and Potential for Field Testing
The preliminary study on the feasibility of applying this viscometer to SCC was conducted in two steps. In the first step, the properties of SCC pastes made with the same w/c and different contents of superplasticizer (SP) and viscosity-modifying-admixtures (VMA) contents were studied. In the second step, the research was carried out on SCC mortars made with various sand contents but the same paste matrix.
Paste with Various VMA Dosage
An example of the falling ball viscometer measurement for paste of w/c=0.35 with a VMA dosage of 0.15% (by mass of water) is shown in Fig. 4. An obvious shear-thinning phenomenon can be observed since the drag force is not linearly related to the ball velocity. This hints that the falling ball viscometer is very sensitive to the rheological behavior of the measured liquid. For all the cement pastes made with VMA, the plastic viscosity was calculated by using linear regression of the upper portion of the D - V curve ![]() (Fig. 4). Both the plastic viscosity and the yield stress are plotted as a function of VMA dosage in Fig. 5. As expected, an increase of the viscosity is obtained when the VMA content is increased. It should be noted that the use of this particular polysaccharide-based VMA increased both the yield stress and the plastic viscosity of the cement paste.
(Fig. 4). Both the plastic viscosity and the yield stress are plotted as a function of VMA dosage in Fig. 5. As expected, an increase of the viscosity is obtained when the VMA content is increased. It should be noted that the use of this particular polysaccharide-based VMA increased both the yield stress and the plastic viscosity of the cement paste.
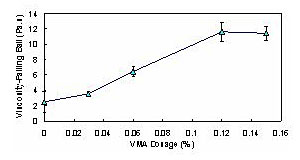
(a) Plastic Viscosity
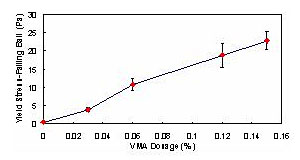
(b) Yield Stress
Fig. 5 Sensitivity of the falling ball viscometer to VMA dosages
Mortars with Various Sand Contents
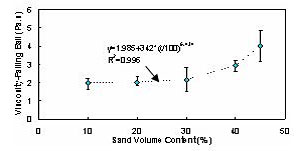
Mortar samples with various sand contents (10%-50% by the volume of the total mortar mixture) were measured using a steel ball with a 1.25 inch (3.175 cm) diameter. The calculated viscosities from the falling ball viscometer for each mortar are plotted in Fig. 6 (a). It can be noted that the viscosity changes slightly when the sand content is less than 30% of the total volume of the mixture. When the sand content is higher than 30%, a significant increase in plastic viscosity with increase of sand content can take place. This result corresponds well to the results obtained by Ferraris et al.
(a) Plastic Viscosity
(b) Yield Stress & Slump flow
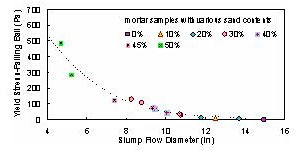
Fig. 6 Measurements on mortars with various sand contents
It was found that the yield stresses of various batches of mortars can vary over a wide range when the mixture proportioning is kept constant. Qualitatively speaking, the mortar with a bigger flow diameter (mini-slump size: 70 mm and 100 mm for the upper inner and lower inner diameters, and 50 mm for the height) has a lower yield stress. The relationship between the slump flow diameter and yield stress was further studied. Fig. 6 (b) plots the yield stress as a function of slump flow diameter for all the mortars measured. A unique relationship between the two studied parameters can be found, which is similar to the results reported by other researchers. This strong correlation confirms that the yield stress can be the dominant parameter that governs the slump flow diameter. However, the influences from other parameters, such as mass density, viscosity, surface tension, etc, should not be ignored.
Potential for Field Testing
The scale, the spring, and the steel balls can be easily assembled, disassembled, packed, and carried to any field that requires the in-situ measurement. The lightweight and portability of the equipment make this viscometer a field and lab friendly equipment. It is easy to clean the ball after each measurement, thus the easiness of the maintenance becomes another advantage of this equipment. The cost of the equipment is 15 to 25 times less than any existing concrete viscometer. The designed viscometer has proved to be efficient for both cement pastes and mortars. This enhances the potential of the application of this viscometer to concrete without changing the existing configuration. Directly measurement to concrete will be conducted as the next step.
Measuring the Segregation Resistance
Stability and homogeneity of SCC are two key issues that influence the mechanical and durability performance of the material in its hardened state. Thus, concrete is required to have the ability to resist the segregation of aggregate throughout the mixing, transportation and casting process. Due to the high flowability of SCC, it is much more susceptible to stability problem than normal concrete. This hints that it is urgent to have a test method to evaluate segregation in the field.
Material stability has a two-fold meaning. Dynamic stability refers to the resistance of concrete to separation during movement (e.g. mixing, placement into the formwork). Static stability refers to the resistance of SCC to bleeding and segregation after the SCC is cast until it is hardened. Test methods to measure both the dynamic and static segregation resistance of SCC are needed.
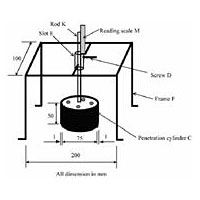
Fig. 7 Penetration Apparatus
Currently, the most commonly used methods to evaluate segregation resistance are the visual examination method, the column segregation test (ASTM C 1610), and the V-funnel method. In the visual examination method, segregation resistance is evaluated by observing the periphery of the concrete after the slump flow test. A visual stability index ranging from 0 to 3 is used to rate the SCC. The method evaluates segregation qualitatively and it relies on the experience of the examiner. In the column segregation method, the coarse aggregates are sieved from the concrete in the top and bottom section of a column after 15 minutes of casting. The percent of static segregation is then evaluated according to ASTM C 1610. The V-funnel method was firstly developed in Japan and consists of measuring the variation of flow times following different periods of resting after filling the SCC in the V-funnel. Again, this method does not give a quantitative evaluation of segregation. The penetration apparatus (PA) method was first introduced by Bui et al. to qualitatively evaluate the static segregation of SCC. The structure of the apparatus produced by ACBM is shown in Fig. 7.
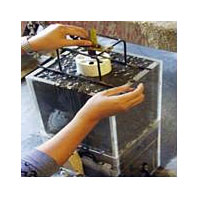
Fig. 8 Application of the penetration apparatus
The test can be combined with the L-box test. During the test, the PA is located on the top of the vertical leg of the L-box, and the penetration cylinder is then adjusted to just touch the upper surface of concrete (Fig. 8). After releasing the screw, the cylinder is allowed to penetrate freely into the concrete for 45 seconds. The final penetration depth can be recorded by reading the scale. It was found that a good segregation resistance of the tested SCC can be indicated by a penetration depth that was less than 7 mm.
Some of the other new testing methods that are under development at ACBM are discussed in the following sections.
Segregation Probe Test
System Configuration
The segregation probe, inspired by the Penetration Apparatus method, is a fast and effective method to measure the thickness of mortar/paste at the top of fresh SCC. A thicker layer of mortar/paste at the surface corresponds to a lower static stability. The results of the segregation probe method and the measured thickness of the mortar/paste layer in hardened concrete were found to be quite similar.
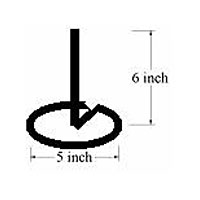
Fig. 9 Segregation Probe
The segregation probe is a 125mm (5 in.) diameter ring connected with a 150 mm (6 in.) high rod marked with scale (Fig. 9). The whole probe is made of 1.6-mm (1/16 in.) diameter steel wire. The total weight of the probe is about 18g. Before the test, fresh concrete is cast into a 150 x 300 mm (6 × 12 in.) cylinder with one lift. The concrete is allowed to rest for 2 min. before the test, during which excessive disturbance is avoided. The segregation probe is then placed gently on the concrete surface allowed to settle for 1 minute. The penetration depth marked on the rod is used to determine the stability rating according to Table 1.
|
||||||||||||||||||
Penetration Mechanism
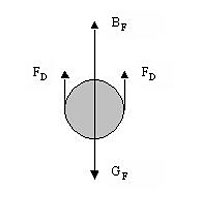
Fig. 10 Forces acting on a cylinder in a liquid
When the segregation probe is suspended at rest in a suspension it experiences two opposing forces, buoyancy force BF and gravitational attraction GF. Due to the higher density of steel compared to the measured liquid, the unbalanced force, (GF - BF), will cause the probe to accelerate downward if yield stress of the liquid is not high enough. The resistance offered by the liquid is called the skin friction. Skin friction results in the development of a drag force, FD, which opposes the motion and increases with increasing particle velocity relative to the liquid (Fig. 10). FD reduces the acceleration and finally becomes equal to the original driving force (GF - BF). Then there are no more unopposed forces acting on the particle and it continues to travel at a constant settling velocity, v∞.
According to fluid mechanics, this drag force can be expressed by equation 4, where d denotes the diameter of the cylindrical cross section of the probe, v denotes the velocity of the probe, and η represents the viscosity of the liquid. It is widely accepted that concrete flows as a Bingham material. Thus, it is necessary to replace the viscosity in equation 4 by the apparent viscosity as shown in equation 5. In the equation, τ0 represents the yield stress and ![]() is the shear rate, which can be related to the velocity of the probe.
is the shear rate, which can be related to the velocity of the probe.
![]() (2.4)
(2.4)
![]() (2.5)
(2.5)
Considering the final state of the probe, the equilibrium condition has to be satisfied, which leads to the expression of the final velocity of the probe that shown as follows:
![]() (2.6)
(2.6)
where ![]() and
and ![]() are the mass density of the probe and the tested liquid, respectively. It is obvious that the segregation probe will not penetrate the liquid if the yield stress is big enough (equation 7). A typical value of critical yield stress is 28 Pa, which can be calculated by using the density of a cement paste with w/c=0.35. This means the segregation probe penetrates when the yield stress of suspension is less than 28 Pa and keeps still when yield stress exceeds 28 Pa. For SCC, normally the yield stress of its paste matrix is smaller than this critical value, and the yield stress for SCC composite is higher than this value. Thus, the segregation probe should be efficient to evaluate the segregation resistance of SCC.
are the mass density of the probe and the tested liquid, respectively. It is obvious that the segregation probe will not penetrate the liquid if the yield stress is big enough (equation 7). A typical value of critical yield stress is 28 Pa, which can be calculated by using the density of a cement paste with w/c=0.35. This means the segregation probe penetrates when the yield stress of suspension is less than 28 Pa and keeps still when yield stress exceeds 28 Pa. For SCC, normally the yield stress of its paste matrix is smaller than this critical value, and the yield stress for SCC composite is higher than this value. Thus, the segregation probe should be efficient to evaluate the segregation resistance of SCC.
![]() (2.7)
(2.7)
Experimental Results
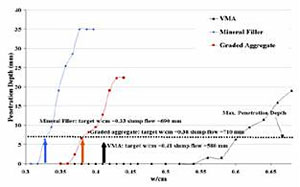
Fig. 11 Using Segregation Probe to Compare Robustness of SCC
Fig. 11 gives an example in which the segregation probe was used to determine robustness of SCC mixtures to moisture content. The VMA mix has a lower slope of the curve and a larger margin between target w/cm and maximum penetration depth and thus is more robust to moisture content than the other two mixes.
Potential for Field Testing
The segregation probe test is simple and rapid and thus is suitable for quality control and other applications such as robustness measurement. The segregation probe is lightweight, and the test does not rely on the experience of the tester. Due to these reasons, this method is a field-friendly method.
Other Methods in Segregation Measurement
Other test methods that can evaluate the segregation for SCC in a hardened state were also developed at UIUC. In the image analysis method, a concrete cylinder is cut lengthwise into two, and a digital photo is then taken of the cut surface. Image analysis software is used to calculate and compare the percentages of coarse aggregates in different levels of the cut cylinder. Due to the large amount of work needed to prepare and analyze the image, this method is good for the purpose of laboratory study. Another method, called visual stability rating method, was developed for both the field and laboratory testing. In this method, the SCC cylinder is cut lengthwise, and the cut surface is then used to observe the distribution of the coarse aggregates. A Hardened Visual Stability Index (HVSI) is used to assess the stability.
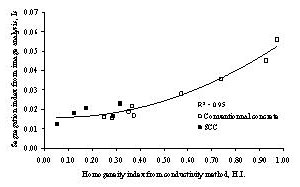
Fig. 12 Relationship between segregation index from image analysis and homogeneity index from electrical conductivity approach
For fresh SCC, besides the segregation probe test, eddy current test was also introduced by researchers at UIUC. In this method, a concrete covermeter is used to monitor the position of a metallic aggregate, which is designed to have similar size and density to normal coarse aggregate. This method has a high requirement on the instrument. It measures the position of a single metallic aggregate. However, this method can monitor the settling process in most kinds of suspensions, which may help to understand the segregation mechanism.
A multi-pair electrode conductivity approach was also introduced by Khayat, et. al at Université de Sherbrooke, who is a partner of ACBM. The method relies on measuring the differences in electrical conductivity measured at different depths, and as a function of time. The variations in electrical conductivity throughout the sample as a function of time are used to interpret the material homogeneity. Good correlations were established between the stability of concrete determined from physical testing (external bleeding and homogeneity of coarse aggregate distribution along hardened concrete samples) and the bleeding, segregation, and homogeneity indices evaluated from the conductivity approach, as illustrated in Fig.12. The electrical conductivity approach can even be used for quality control on the job site. Variations in electrical conductivity after 20 min of testing can be related to the various indices determined from the conductivity approach, as illustrated in Fig. 13. Thus, the method provides with the reliable measurement on the stability of concrete.
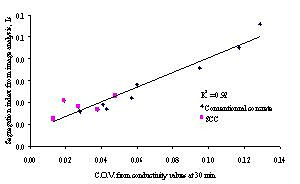
Fig. 13 Variation of segregation index determined from image analysis and coefficient of variation of conductivity values after 20 min of testing (30 min of age)
Khayat et al. developed a pressure filter test to evaluate the ability of SCC to retain its mix water. The test involves the placement of approximately 5 kg of concrete sample in a pressure vessel measuring with compressed air of 700 kPa. The forced bleed water is monitored for 10 minutes to determine the water permeability of the fresh concrete using Darcy's law. The test was shown to be effective in differentiating between the stability of SCC made with different binder contents, w/cm, and VMA concentrations and can be suitable for quality control of SCC in the field.
Summary and Future Research
Recent innovations are presented herein to evaluate the rheological properties and static segregation resistance of SCC quantitatively. Both the falling ball viscometer and the segregation probe prove to have high potential for field testing due to the simple theoretical background, the easiness of applying the measurement, the lightweight equipment, and the rapid testing procedure. The precision and reproducibility of the introduced methods need to be further investigated. These testing methods along with the multi-pair electrode conductivity method can be used as quality control methods. They help to improve the understanding of the material behavior. The results of this part of the work can be closely related to other research conducted at ACBM. For example, segregation probe test can be used to study the robustness of SCC, and the yield stress and viscosity measurements can help to understand the formwork pressure produced by SCC. It is necessary to develop a test method to evaluate the dynamic segregation of concrete.
1. Skarendahl, Ǻ. and Petersson, Ö. (Ed.) Proceedings of the First International Symposium, RILEM TC 174-SCC. 1999, 790pp.
2. Ozawa, K. and Ouchi, M. (Ed.) Proceedings of the International Workshop on Self- Compacting Concrete, Kochi, Japan, JSCE Concrete Engineering Series 30, 1998, 400pp.
3. Proceedings of the First North American Conference on the Design and Use of Self-Consolidating Concrete, Chicago, USA, 2002, CD-ROM.
4. Proceedings of Knud Hojgaard Conference on Advanced Cement Based Material, June 2005. Denmark.
5. Grünewald, S. and Walraven, J.C. “Rheological measurements on self-compacting fibre reinforced concrete,” 2003, 3rd International Symposium on Self-Compacting Concrete, pp. 49-58.
6. Khayat, K.H. “Workability, testing, and performance of self-consolidating concrete,” ACI Materials Journal, V. 96, No. 3, 1999, pp. 346-353.
7. Coussor, P. Rheologie des Bouse et Laves Torrentielles-Etudes de Dispersions et Suspensions Concentrees, L’Institut National Polytechnique de Grenoble, et Etudes du Cemagref, 418pp.
8. Wallevik, O.H. and Gjoru, O.E. “Development of coaxial cylinder viscometer for fresh concrete,” Properties of Concrete, Proceeding of RILEM Colloqium, Hanover, 1990, pp.213-224.
9. Hu, C., de Lallard, F., Sedran, T., Boulay, C., Bosc, F., and Deflorenne, F. “Validation of BTRHEOM, the new rheometer for soft-to-fluid concrete” Materials and Structures, V. 29, No. 194, 1996, pp. 620-631.
10. Struble, L.J., Puri, U., and Ji, X. “Concrete rheometer,” Advances in Cement Research, V. 13, No. 2, 2001, pp. 53-63.
11. Ferraris, C.F. and Brower, L.E. Comparison of Concrete Rheometers: International Tests at MB (Cleveland OH, USA) in May, 2003, National Institute of Standards and Technology, NISTIR 7154, 2004. pp. 1-62.
12. Stauberg Greenwood, M, Fazio, F., Russotto, M., and Wilkosz, A. “Using the Atwood Machine to Study Stokes’ Law,” American Journal of Physics, V. 54, No. 10, 1986, pp.904-906.
13. Tran-Son-Tay, R., Beaty, B.B., Acker, D.N., and Hochmuth, R.M. “Magnetically driven, acoustically tracked, translating-ball rheometer for small, opaque samples,” Review of Scientific Instruments, V. 58, No. 8, 1988, pp. 1399-1404.
14. Gregori, A., Sun, Z., Douglas, R., Shah, S.P. and Bonen, D. “The evaluation of viscosity by using a novel viscometer for SCC,” Proceedings of the 2nd North American Conference on the Design and Use of Self-Consolidating Concrete and the 4th International RILEM Symposium on Self-Compacting Concrete, 2005,
Chicago, USA., pp. 775-781.
15. Douglas, R., Gregori, A., Sun, Z. and Shah, S.P. “Investigations of the properties of SCC: a method for measuring thixotropy and viscosity,” Proceedings of Knud Hojgaard Conference on Advanced Cement Based Material, June 2005. Denmark.
16. Truesdell, C. and Rajagopal, K.R. An introduction to the mechanics of fluids, 2000, Boston, U.S.A., 277pp.
17. Sun, Z., Gregori, A., Ferron, D. and Shah, S.P. “Determining the rheological properties of SCC with a falling ball viscometer,” submitted to ACI Materials Journal, 2005.
18. Ferraris, C.F., Obla, K.H., and Hill, R. “The influence of mineral admixtures on the rheology of cement paste and concrete,” Cement and Concrete Research, V. 31, 2001, pp. 245-255.
19. Saak, A., Jennings, H.M., and Shah, S.P. “A generalized approach for the determination of yield stress by slump and slump flow,” Cement and Concrete Research, V. 34, No.3, 2004, pp. 363-371.
20. Ferraris, C.F. and Martys, N.S. “Relating fresh concrete viscosity measurements from different rheometers,” Journal of Research of the National Institute of Standards and Technology, V. 108, 2003, pp. 229-234.
21. Standard Test Method for Slump Flow and Stability of Hydraulic-Cement Self-Consolidating Concrete, Illinois Test Procedure SCC-2, July 1, 2004
22. Standard Test Method for Static Segregation of Hydraulic-Cement Self-Consolidating Concrete Using the Column Technique, Illinois Test Procedure SCC-5, July 1, 2004
23. Japan Society of Civil Engineers, Recommendation for Self-Consolidating Concrete, T. Omoto and K. Ozawa, eds., JSCE Concrete Engineering Series 31, 1999, pp.77
24. Bui, V.K., Montgomery D., Hinczak I., Turner K., “Rapid testing method for segregation resistance of self-compacting concrete”, Cement and Concrete Research, V. 32, No. 9, 2002, pp.1489–1496
25. Shen, L., Struble, L. and Lange, D. “Testing static segregation of SCC,” Proceedings SCC 2005, The 2nd North American Conference on the Design and Use of Self-Consolidating Concrete and the 4th International RILEM Symposium on Self-Compacting Concrete, Oct 2005, Chicago, USA, pp. 729-735.
26. Khayat, K.H., Pavate, T., Assaad, J., Jolicoeur, C., “Analysis of Variations in Electrical Conductivity to Assess Stability of Cement-Based Materials,” ACI Materials Journal, V. 100, No. 4, 2003, pp.342-350.
27. Khayat, K.H., Vanhove, Y., Pavate, T., Jolicoeur, C., “Non-Destructive Method to Evaluate Segregation of Concrete,” Proc., 2nd North American Conf. on the Design and Use of Self-Consolidating Concrete, Chicago, Nov. 2005.
28. Khayat, K.H., Assaad, J., Daczko, J., “Comparison of Field-Oriented Test Methods to Assess Dynamic Stability of Self-Consolidating Concrete,” ACI Materials Journal, V. 101, No. 2, 2004, pp. 168-176.